Let’s talk about the following scenario. You have an employee that is leaving your company. Because the leaving employee thinks that he has the rights to all of the companies documents he starts downloading them for later use and sends the documents to his private email account using Dropbox. Wouldn’t you want to be notified of such a scenario?
Enter Microsoft Purview Insider Risk Management (IRM). A solution that collects information from all kinds of different sources like Microsoft 365 and perhaps other services like your HR-system. In IRM, you can create various policies that let you monitor all sorts of policy violations. A few examples are:
- Data theft by departing users
- Various kinds of data leaks
- Various kinds of policy violations
- Health record misuse
- Risky browser usage
IRM provides you with workflows to help your organization detect the above potential risks, manage them by cases and take various actions on the risks that are found in your environment. Ready to find out more by using an example? Let’s go!
Prerequisites
When you first navigate to the IRM console, you are greeted with a few recommendations to get you started.
Turn on analytics

The first one is shown in the picture above and let’s you turn on analytics to scan for potential risks. When you enable this, user activities are scanned on a daily basis to identify potential risks occurring in you environment. The first scan can take 48 hours to complete as it scans your audit log and Microsoft Entra ID. When it’s done, it provides you with an email when there are insights and IRM policy recommendations to check up on. Note that if you don’t have audit logging enabled for your tenant (which is enabled by default nowadays) now is a good time to do so.
Read the Manual
When you have taken the first hurdle, the second recommendation is to read about the solution on Microsoft Learn so be sure to take a night out of your schedule to read up on the latest and greatest of IRM.
Configure global IRM settings
After this, we can get to work by configuring the global IRM settings.
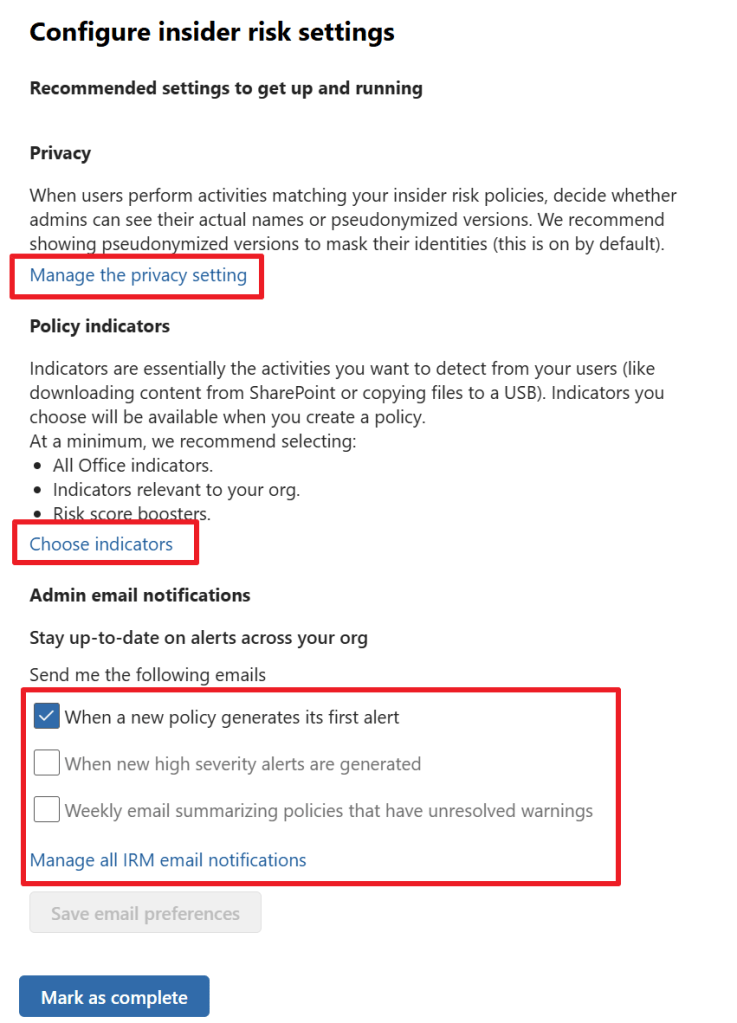
Here there are various settings to think about and take care of. Let’s start with the privacy setting. Here, you can choose whether you want the portal to show actual usernames or pseudonymized versions of the usernames. Do note that pseudonymizing usernames disables data sharing between IRM and other solutions within Purview.
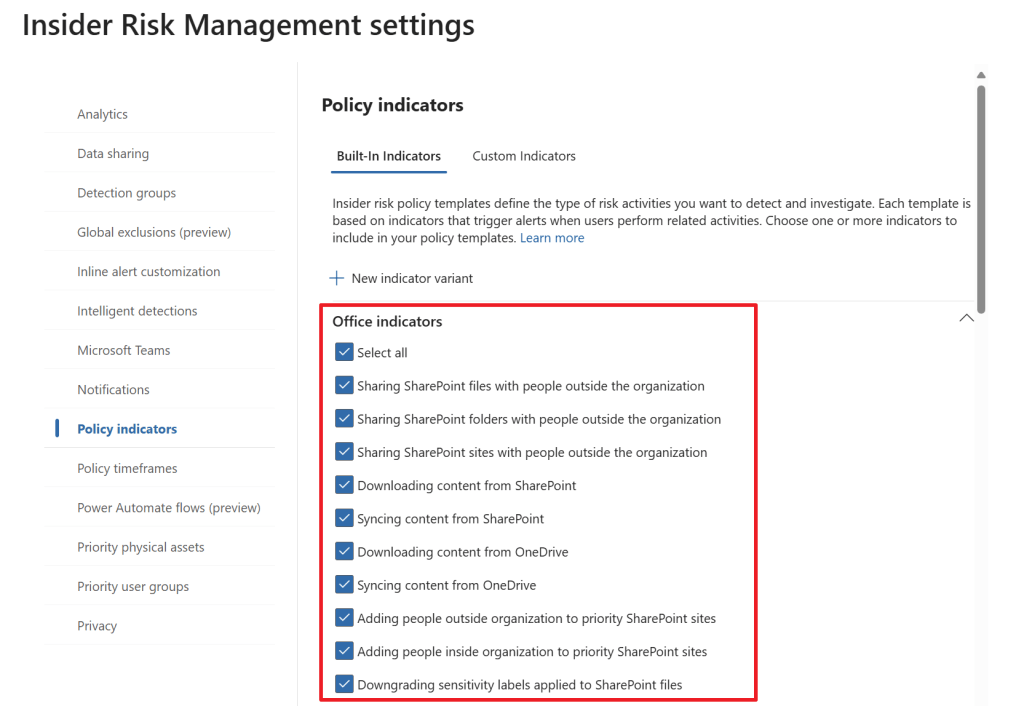
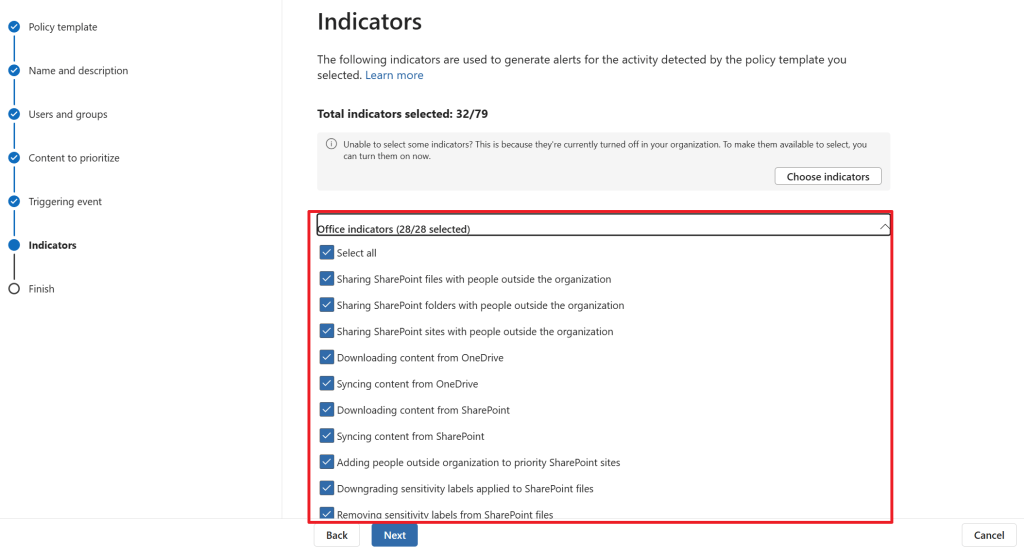
Like the help text tells us, policy indicators are the actual activities you want to detect in your environment. These can be Office indicators like in the screenshot above. For example, downloading content from SharePoint, Syncing content from OneDrive and so on. There are also indicators from other categories, like device indicators which let us monitor activities on devices. Examples here are creating or copying files to USB, printing files and using a browser to download content from a third-party site. In this case, I select all available office indicators for our demo. If the default indicators don’t match your needs, you can always create your custom indicators.
The last thing to set up is which email notifications your admin account should receive. I leave the defaults to only receive emails when a new policy receives it’s first alert.
When this is taken care of the last steps let you set up permissions for IRM so your team can do their job and lastly create your first policy. Let’s zoom in on creating a policy and what it’s effects are in your environment.
Setting up a policy

Let’s navigate to the Microsoft Purview portal and select the Insider Risk Management solution. Next, click policies and select ‘Create policy’.
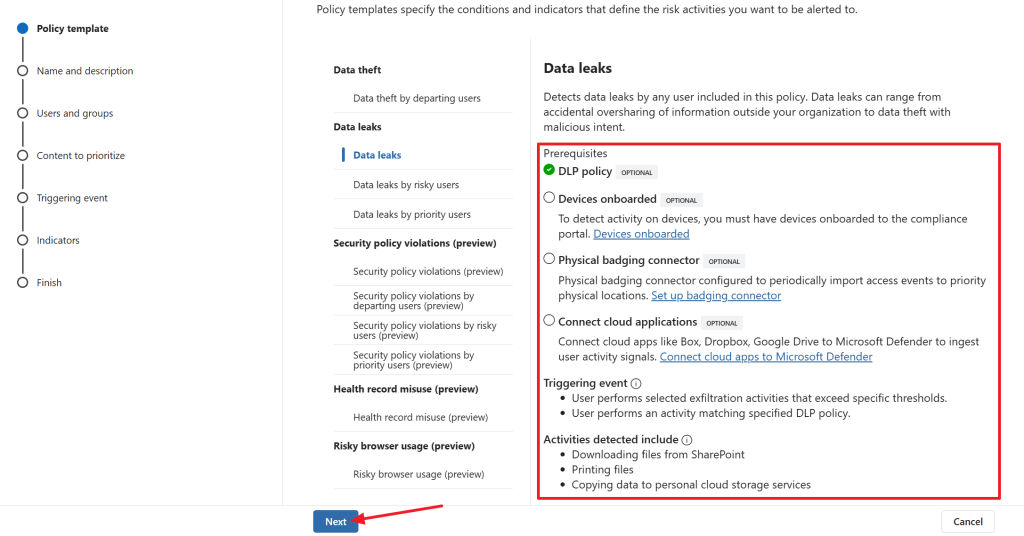
Immediately we are shown with a dialog asking us what kind of policy that we want to create. Let’s select ‘Data leaks’. Remember those data sources we talked about? Here it’s time to review which data sources are mandatory or optional for this policy type. As I already have a Data Loss Prevention (DLP) policy in my environment, it is found by the wizard. As can be seen it’s also possible to connect a physical badging connector to see to which physical locations a user had access and use this in the policy or you can choose to connect cloud applications like Dropbox and Google drive, so you can monitor them for data being uploaded or downloaded to or from the services.
To trigger this policy, a user has to perform an exfiltration activity that exceeds specific tresholds or a user performs an activity matching specified DLP policy. Activities that are detected in this policy are downloading files from SharePoint, printing files or copying data to personal cloud storage services (which is why one would want to connect Dropbox and the likes).
Next, name your policy and give it a nice description.
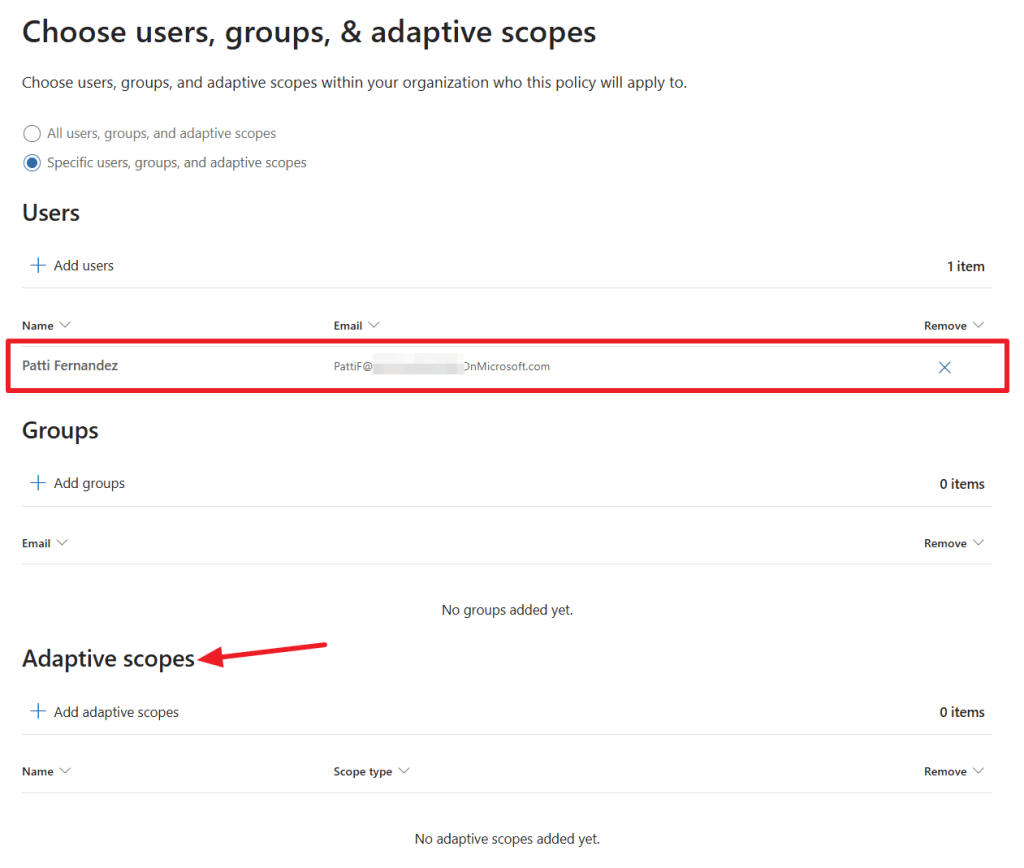
Next we can use an adaptive scope or select users and groups to which we want to apply this policy. To makes things simple for this example, I’ve chosen to apply the policy to a user named ‘Patti Fernandez’ only. In the next screen, we can choose to prioritize content on a specific SharePoint site, or content that contains sensitivity labels or certain sensitive info types.
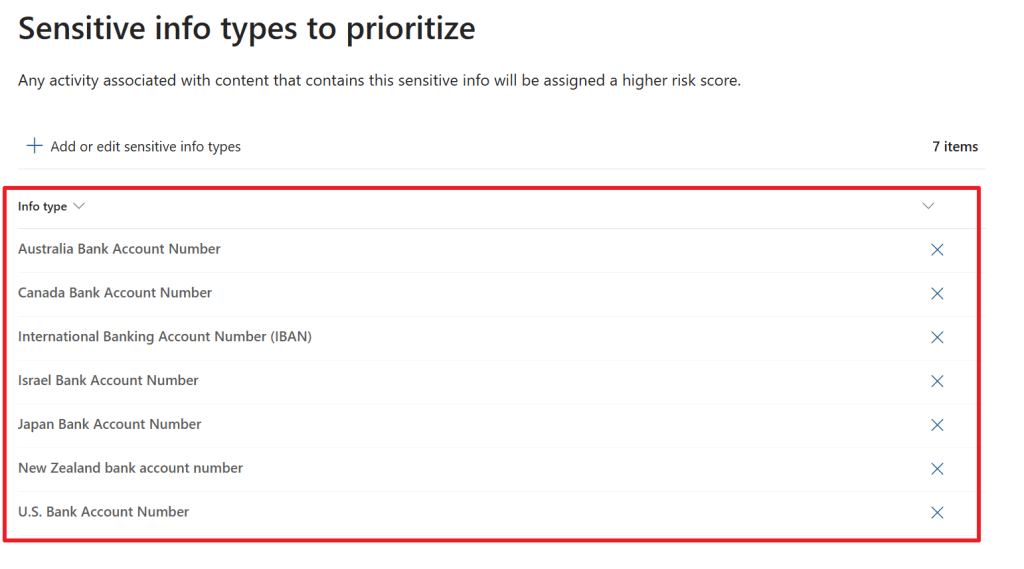
In this example, I have chosen to prioritize content in the ‘Sales and Marketing’ SharePoint site, content that holds the ‘Confidential – Finance’ sensitivity label or one of the sensitive info types that are shown above. If you want, you can also choose to get only alerts for activities that include priority content, or get an alert for all activity that is seen in your environment that matches this policy.
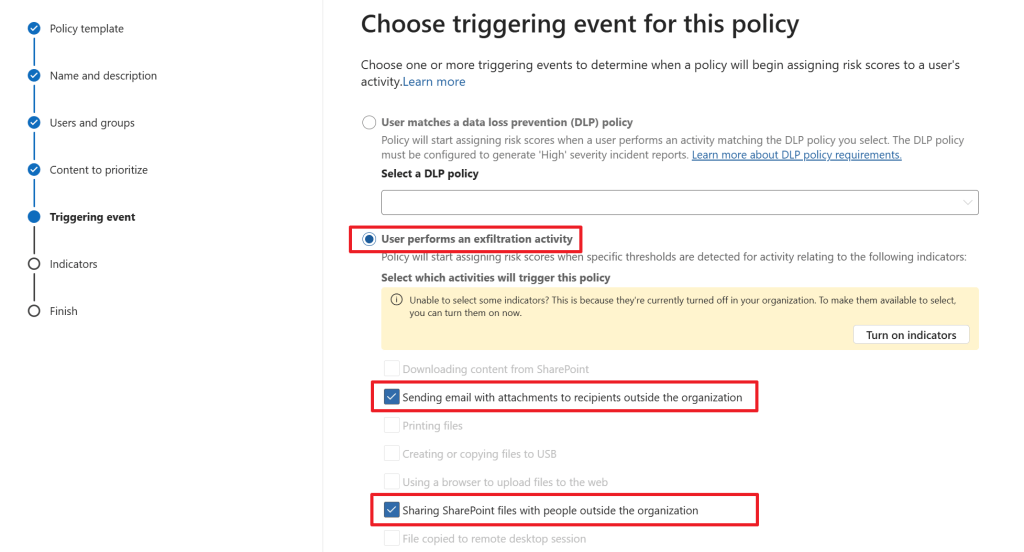
Now for the part that we (or at least I) have been waiting for. How is this policy triggered? We can do so by choosing a DLP policy that has to be matched OR select an exfiltration activity that takes place. I’ve chosen the latter option. In this policy, a user (Patti Fernandez in this case) has to send an email with attachments to recipients outside the organization or share SharePoint files with people outside the organization to trigger this policy.
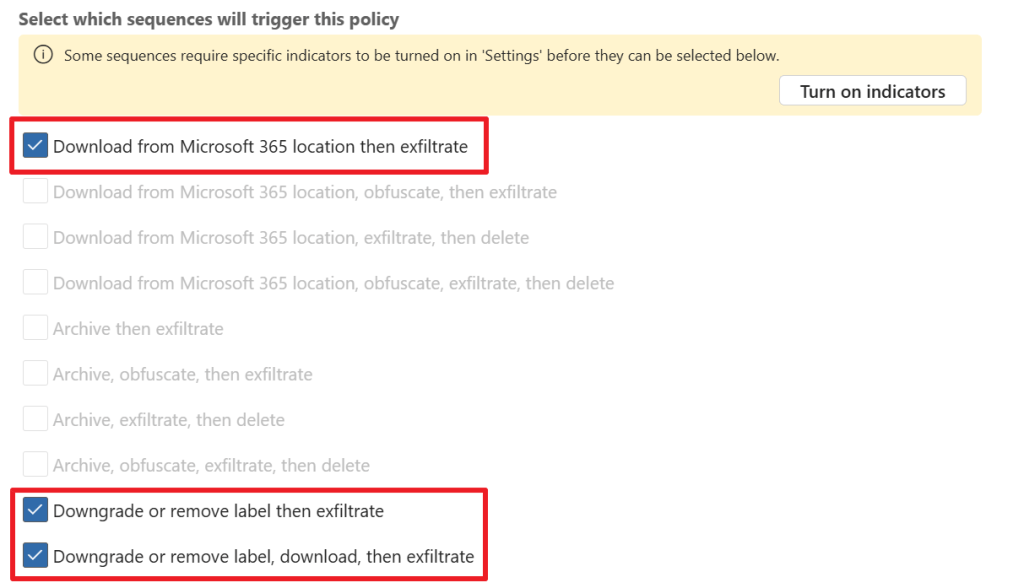
Next, we have to choose which sequence will trigger the policy. In my case I’ve selected the ones above. Exfiltration is the fact that data is stolen from your environment.
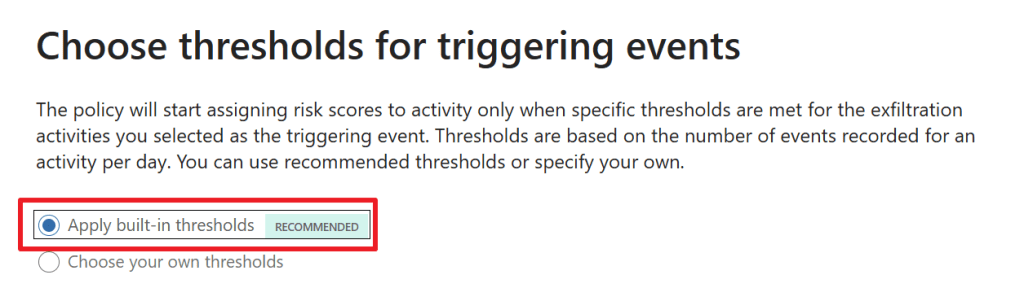
In the next screen, we have to choose which thresholds we want for triggering events. For example, here you can choose the number of times that a document is downloaded from a Microsoft 365 location and then exfiltrated.
Next we have to select indicators (yes, again) which will generate an alert for the activity detected by the policy template we selected (Data leaks in our case). Let’s choose to select all. The same alert generation options have to be chosen for detected sequences.
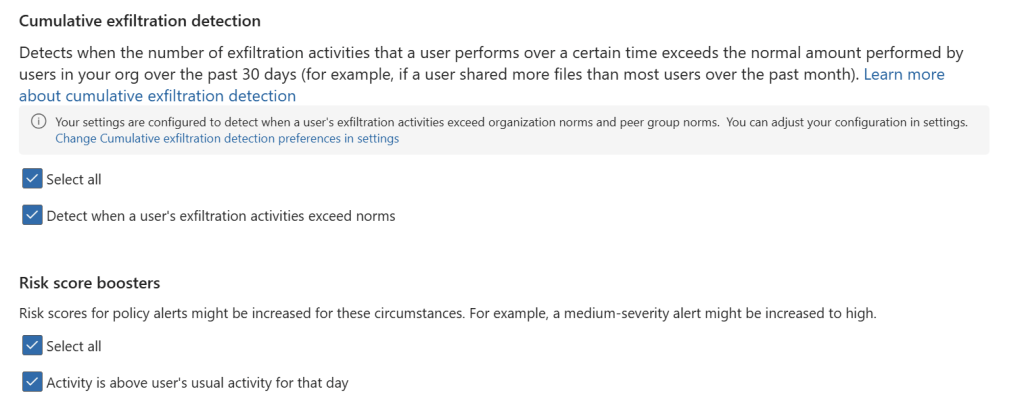
In the ‘cumulative exfiltration detection’ screen, we can configure whether the service should detect when the exfiltration activities that a user performs over a certain time exceeds the normal amount for users in your org over the past 30 days. This can then be used to boost the risk score in your policy.

The indicators we selected before (downloading content from SharePoint, Syncing content from OneDrive and so on) uses thresholds that influence the activity’s risk score, which in turn will determine what the severity for an alert is. For these thresholds we can configure to use the Microsoft defaults or use our own thresholds. However, as can be seen in the screenshot above, after 48 hours it’s possible to let the service use personalized threshold recommendations that are based on your users’ recent activity patterns!
Lastly, as always, review the summary and submit the new policy. Take notice of the screen that tells you that it might take up to 24 hours before policy matches will start showing up on the Alerts tab.
Good user gone bad
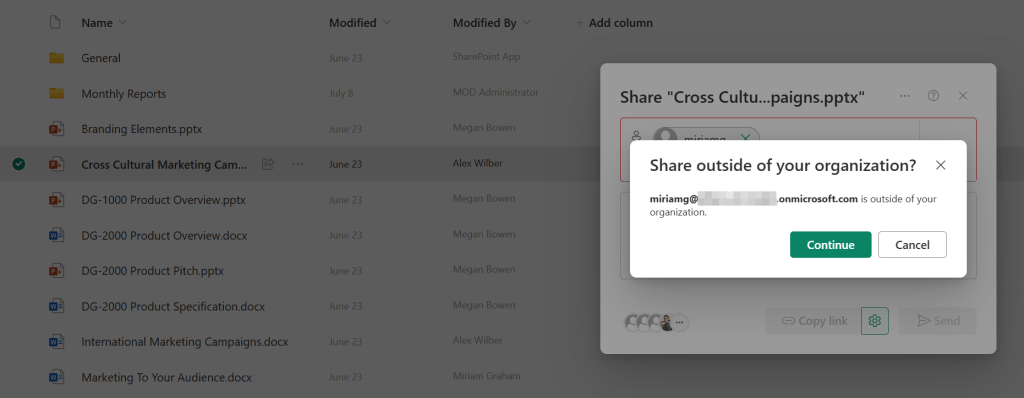
Now let’s enter Patti Fernandez as our ‘good user gone bad’. Patti starts to share a couple of documents from SharePoint to an external user. She sees the notification above but choses to ignore it and share the data anyway. She shares a couple of files in the same way.
Red alert!
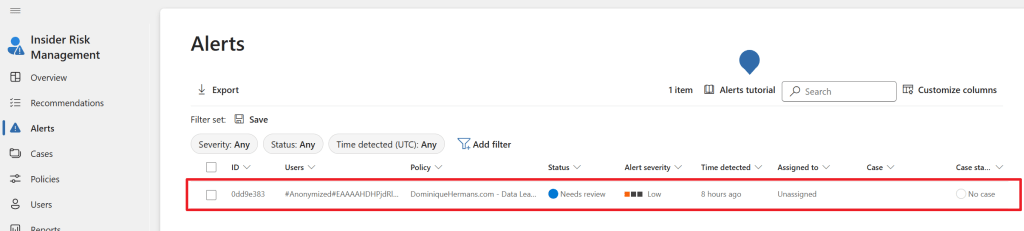
Now let’s return to our admin user and select the ‘Alerts’ screen in IRM. We can see that an alert is generated for a user (which cannot be seen because we choose to pseudonymize usernames) and the status for the alert is set to ‘Needs review’. We can also see that the alert is not yet assigned to a user tasked with taking care of alerts and no case has been generated yet.
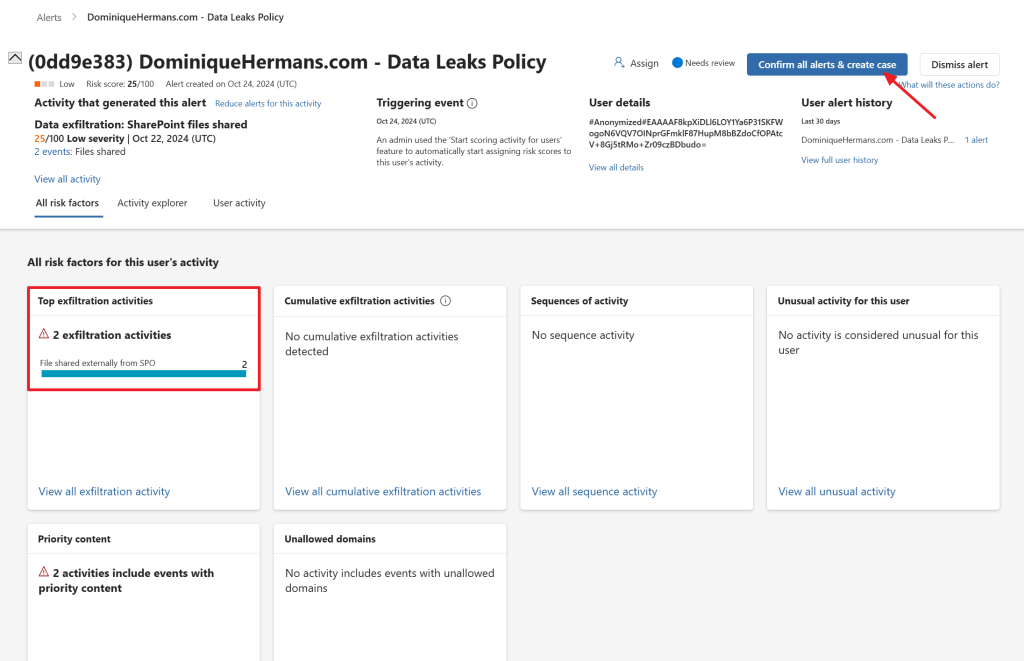
When the alert is opened, we are provided with a whole world of details. What was the triggering event (which I might have slightly manipulated for the policy to trigger 😉), the top exfiltration activities, the severity of the alert and some other details. Let’s confirm the alert and create a case by clicking ‘confirm all alerts & create case’.
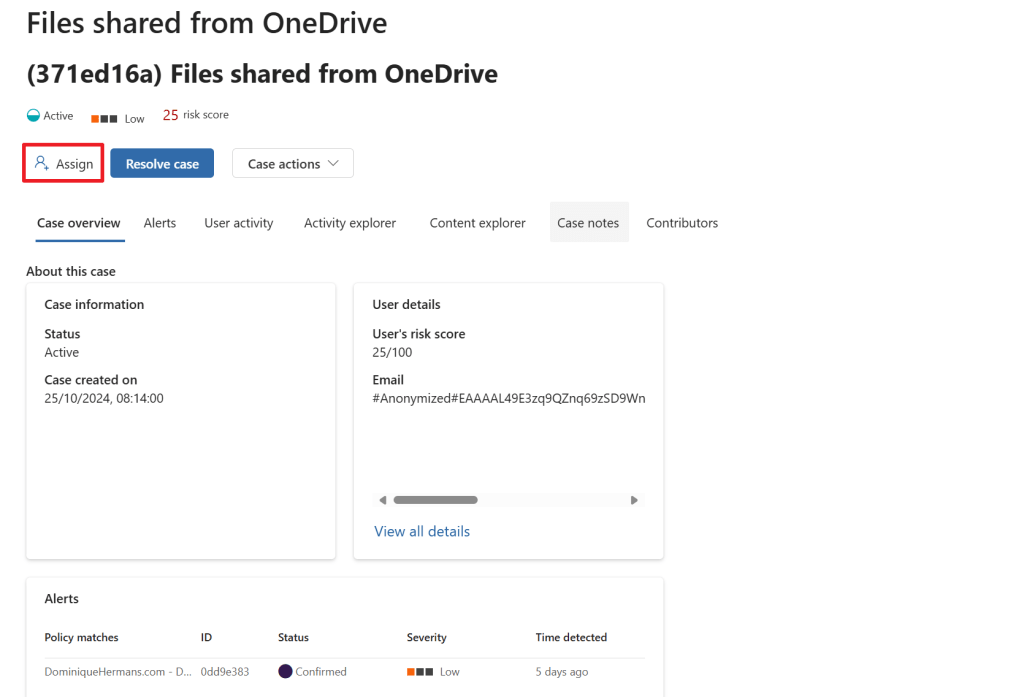
After moving to the cases screen in the IRM portal, select the case we just created and let’s assign it to a fellow IRM employee to start reviewing the case. Let’s go through each tab of this interface to see what information is provided to us via the case. Note that a case can have multiple alerts attached to it, in this demo it is only 1 alert, which can be seen on the ‘alerts’ tab.
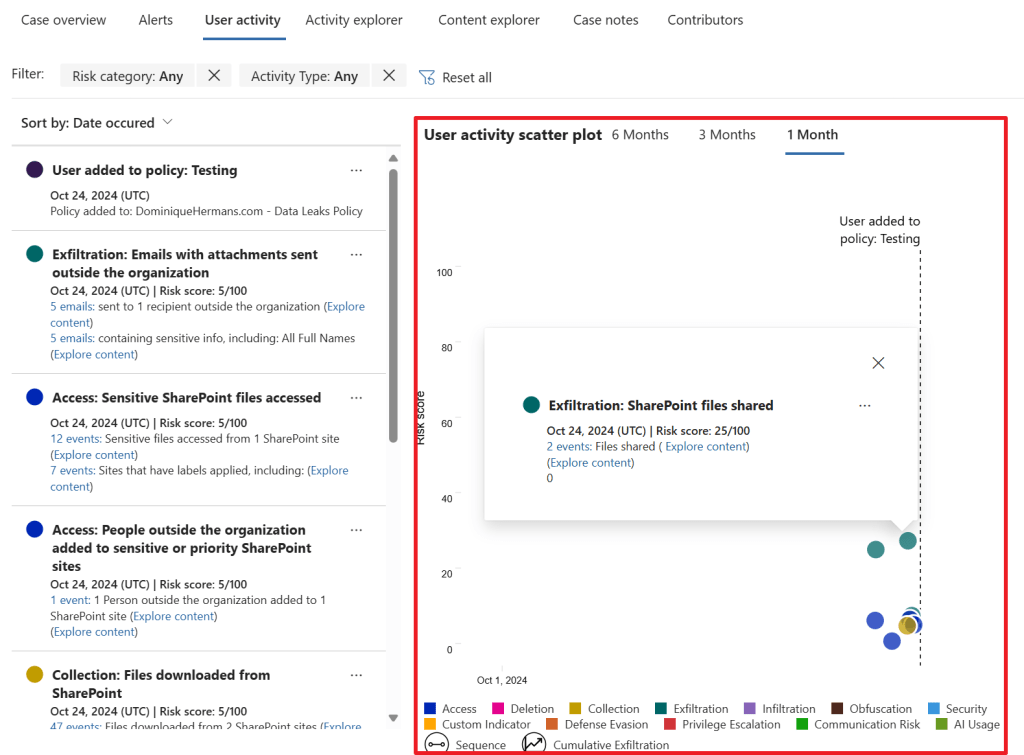
The user activity tab shows us a list of all activities that lead up to this alert and it accumulates this for us in a so-called ‘user activity scatter plot’ in which you can see all user activities that happened over time. Now, this is just an example that was created here, but imagine that your HR system noted that an employee is going to leave the company in a few weeks (which would be a great trigger event), and after this the system shows all kinds of data being exfiltrated to the users personal Dropbox.
This shows the real power of the IRM solution as it uses all these events to create 1 easy to read chart that shows exactly which risk the user actions pose to your company!
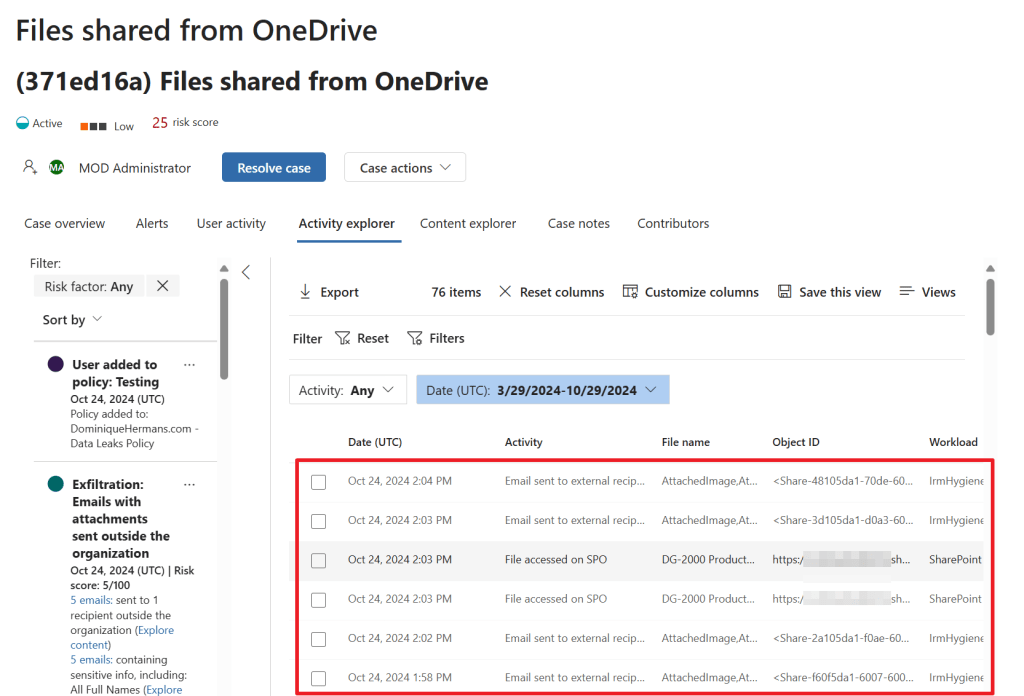
When we select the ‘activity explorer’ tab we can dive a little deeper by taking a look at all the activities the service linked to this case. This really shows a nice detail of what is going on. We can even take a look at the content included in the case from the ‘content explorer’ tab. Really nice to have all this features in 1 GUI.
Last but not least, we can use the ‘case notes’ tab to write down important information about the case and use the ‘contributors’ tab to add other colleagues that may manage the case.
Notice templates
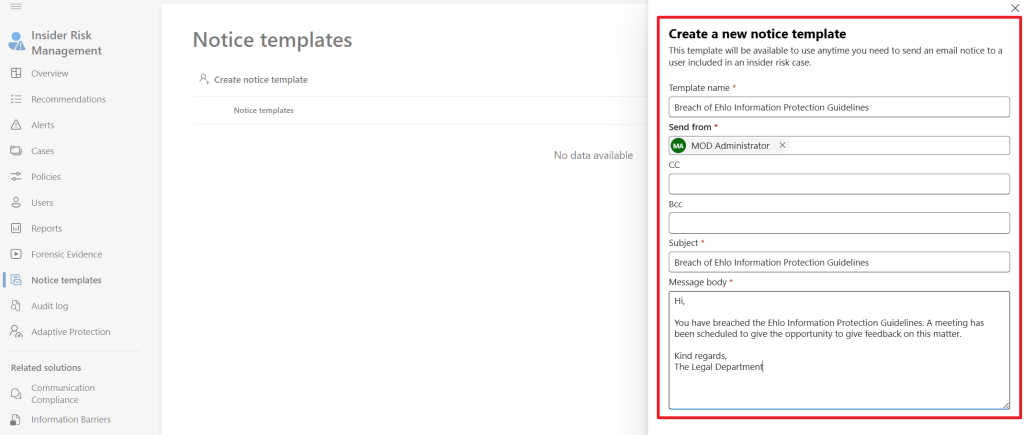
Now, with our case created let’s create a notice template by navigating to IRM, Notice templates. These templates can be used as a starting point to communicate about a case with a user involved in this case. I drafted up the one that is shown above.
Case actions
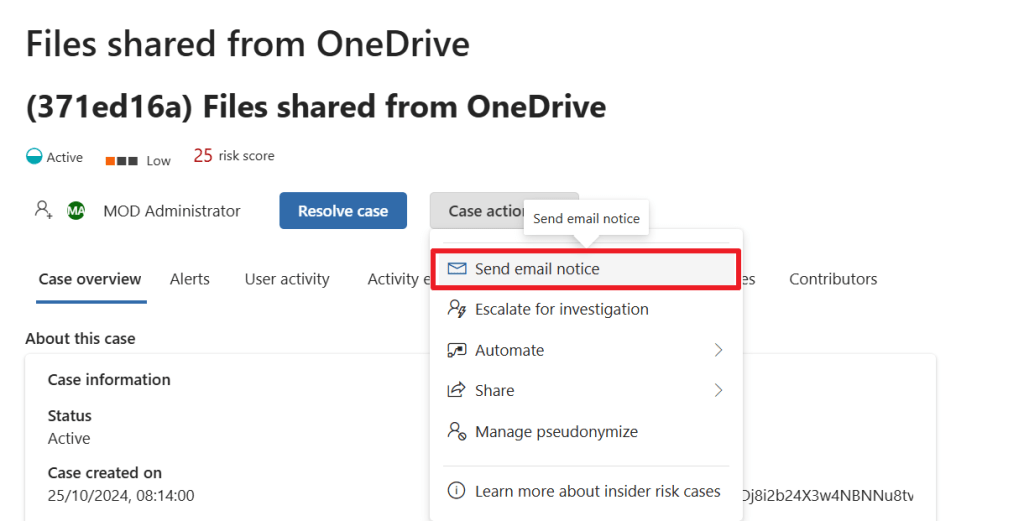
Let’s return to the case we’ve created and select ‘case actions’. It provides us with a few options like escalate the case for investigation, which actually opens an eDiscovery (premium) case in your Microsoft 365 environment that allows the IRM case to be further reviewed, for example for legal purposes. We can also apply a Power Automate action or share the case. Lastly we can manage the pseudonymize options for this case.
Let’s go for ‘send email notice’. We can now select the email notice we created earlier and send the message to the user. We might not be able to identify the user because the data in the IRM portal is pseudonymized, however the system is still able to track down the user.
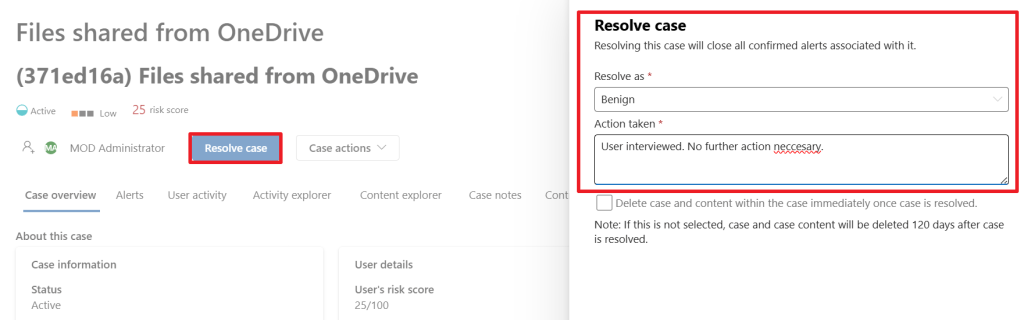
Lastly, depending on the input of our user, the case would be resolved as ‘benign’ which closes the case as no further action is necessary. It’s also possible to resolve the case as a ‘Confirmed policy violation’ in which case you have to take appropriate actions depending on the severity of the case.
I really enjoyed writing this blog and hope you learned something new by reading it!

One thought on “Microsoft Purview 101: Howto setup Insider Risk Management (IRM)”